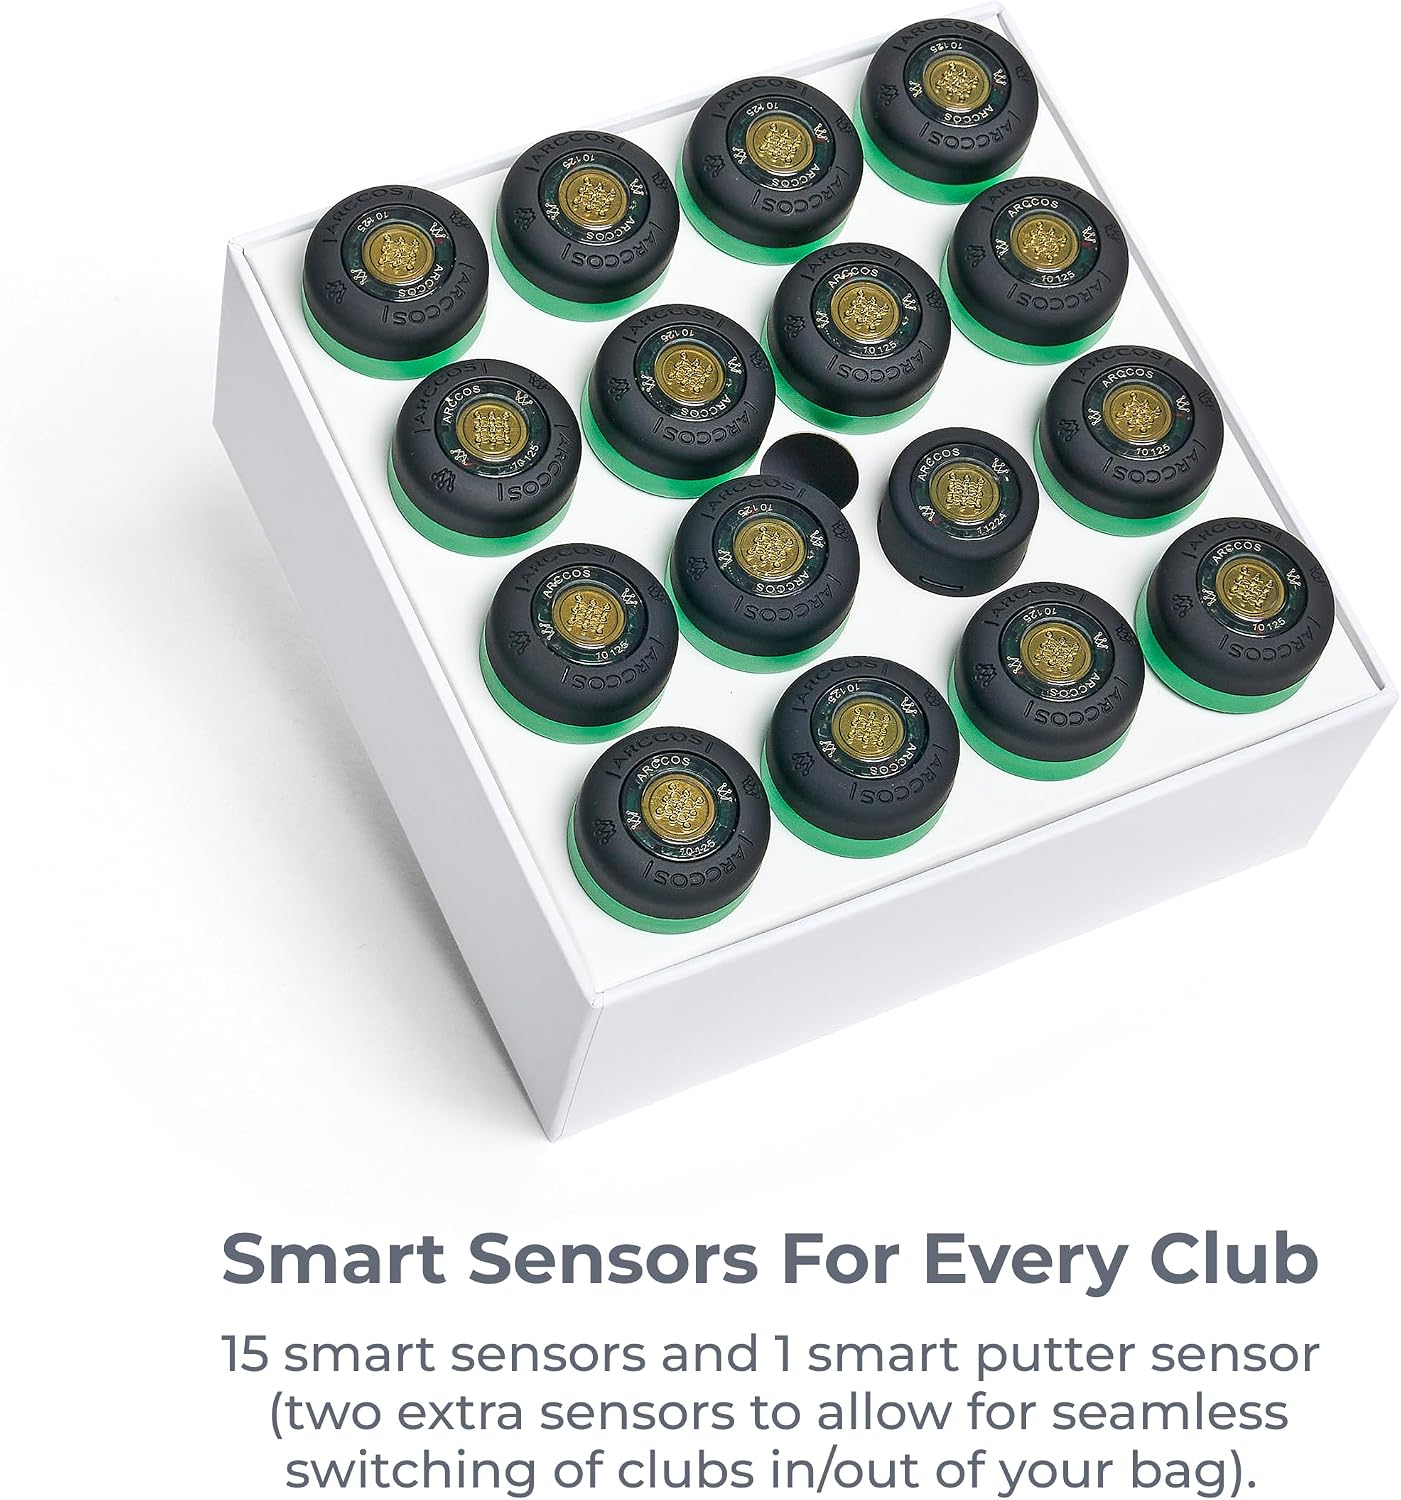
Most golfers walk into a fitting appointment carrying nothing but a vague feeling that something is off with their game. Maybe their drives aren’t going as far as they should, or their irons feel inconsistent from week to week. The fitter asks a few questions, watches a handful of swings on a launch monitor (a device that uses radar or cameras to measure ball speed, launch angle, spin rate, and carry distance), and builds a recommendation from maybe twenty minutes of data. That’s a thin slice. Arccos Smart Sensors — small GPS-enabled devices that screw into the grip end of each club and automatically log every shot you hit on the course — give you something far more powerful: months of real-round evidence about where your game actually leaks strokes. This article is about how to collect that data deliberately, read it fluently, and walk into a fitting with a concrete case for what you need.
What Arccos Is Actually Tracking (and Why It Matters for Fitting)
Arccos sensors work passively. Once installed and paired with the Arccos Caddie app, they detect each swing via accelerometer and triangulate shot location using your phone’s GPS. The system then builds a shot-by-shot map of every round you play, including club used, distance from the last position, and proximity to the hole. Over time, the app runs that data through a Strokes Gained framework — a statistical method, originally developed for tour analytics, that compares your performance on each type of shot to a baseline of golfers at your handicap level.
For a fitting context, three outputs matter most:
1. True average distances, not range distances. Most golfers overestimate their carry distances by 10–20 yards when asked in a fitting bay. Arccos derives your actual on-course carry and total distance per club from GPS position data across dozens of real shots. Golf Digest’s coverage of shot-tracking technology consistently highlights this gap as one of the most disruptive things data reveals — players routinely discover their “7-iron is a 155-yard club” is actually a 142-yard club when mis-hits, uphill lies, and wind are factored in.
2. Strokes Gained by category. The platform segments your performance into Strokes Gained: Off the Tee, Approach, Around the Green, and Putting. A negative number in one category means you’re losing strokes to the average golfer at your handicap in that zone. This is the single most useful number to bring to a fitting, because it tells a fitter which department to prioritize.
3. Proximity patterns. For approach shots specifically, Arccos tracks average proximity to the hole by distance range — say, 100–125 yards versus 150–175 yards. Sudden accuracy drop-offs at certain distances often signal a distance gap between clubs, a transition zone where your swing path changes, or a specific club that’s delivering inconsistent launch conditions.
Building Your Fitting Case: The Three Numbers to Know Before You Walk In
If you’ve been using Arccos for at least two months and 8–10 rounds, you have enough data to build a meaningful pre-fitting brief. Here’s the framework:
Number One: Your Strokes Gained: Approach baseline
Pull this number from the Arccos Caddie app’s Performance dashboard. If you’re losing more than 0.5 strokes per round on approach shots relative to your handicap cohort, irons and wedges are the primary fitting priority — not the driver. GolfWRX’s community discussion threads on strokes gained fitting regularly surface this same conclusion: golfers who fixate on driver distance when their approach numbers are bleeding strokes are solving the wrong problem.
A concrete example of the decision logic:
By the Numbers
- Strokes Gained: Off the Tee = +0.3 (you’re slightly above average for your handicap)
- Strokes Gained: Approach = −0.9 (you’re losing nearly a full stroke per round)
- Strokes Gained: Around the Green = −0.4
Fitting priority order: irons/wedges → short game → driver.
Number Two: Your real carry distances at the transition clubs
Pull your average carry distances for your 5-iron, 6-iron, 7-iron, and your longest wedge from Arccos’s Club Stats view. Look for gaps that exceed 15–18 yards between adjacent clubs — those are distance voids that the ball will find during a round, and no amount of practice fixes a void, only the right loft or shaft combination does. Golf Monthly’s reporting on fitting methodology notes that fitters frequently discover significant distance gaps in the 5-through-7 iron range among mid-handicappers, particularly players who hit a strong 7-iron but then overcook a 5-iron because the shaft is too light.
Also look for clubs where the gap is too small — two clubs within 8 yards of each other suggest one is redundant, and the loft or length spec probably needs adjustment.
Number Three: Your dispersion shape by club
Arccos doesn’t render a traditional dispersion chart the way a Trackman session does, but your shot map — viewable round by round in the app — reveals consistent miss patterns. Screenshot or export several rounds. Are your approach misses predominantly left? Long? Do they cluster differently with long irons versus short irons? This directional information is fitting gold. A fitter using a GCQuad or Trackman 4 will immediately want to correlate your on-course miss pattern with the face angle and path data they see on the monitor. Bringing your Arccos shot maps means the fitting session can validate rather than start from zero.
How to Use This Data in the Fitting Room
Club fitters — particularly those at premium shops running Titleist, Callaway, and TaylorMade fitting days — are increasingly familiar with Arccos data, but they don’t always ask for it. You need to present it proactively. Here’s how to frame the conversation:
Lead with Strokes Gained, not with “I want more distance.” Tell the fitter your SG: Approach number and where you see the biggest proximity drop-off by distance band. That immediately reframes the session from a distance hunt into a dispersion and consistency optimization — which is what fitting is actually for.
Show the distance gap analysis. Print or screenshot your Club Stats distances for your irons. Ask the fitter to show you, on the monitor, whether the loft gaps in the clubs you’re demoing would close the distance voids your Arccos data identified. Plugged In Golf’s long-term Arccos data coverage emphasizes that this kind of before/after comparison is where the sensor system pays its clearest dividend — you have an empirical baseline to compare monitor results against.
Use proximity patterns to evaluate shaft options. If your Arccos data shows a left miss pattern with mid-irons that disappears with short irons, mention it. A fitter might explore shaft weight, flex point (the location along the shaft where it bends most during the swing, affecting launch and spin), or even lie angle (the angle between the shaft and the ground at address, which affects directional flight). Your on-course pattern gives the fitter a directional hypothesis to test rather than starting blind.
Ask for a post-fitting strokes gained projection. Some premium fitting operations — particularly those affiliated with major OEM fitting centers — will model expected SG improvement based on the distance and dispersion improvements measured in the bay. This is still an evolving practice, but it’s increasingly available and it gives you a performance-based framework for evaluating whether a $900 iron set or a $1,200 fitted driver is worth the spend.
The Honest Limits of Arccos Data
Arccos is GPS-based, not launch-monitor-based. It doesn’t measure ball speed, spin rate, or launch angle directly — it infers distances from position changes. MyGolfSpy’s detailed Arccos review notes that GPS accuracy on shot distance can vary by 3–8 yards depending on course mapping quality and phone GPS signal, and that the system occasionally misattributes chips or bump-and-runs to the wrong club. These aren’t dealbreakers, but they mean your Arccos data is a directional portrait of your game, not a precision instrument. The fitting bay is still the place where precise ball flight numbers get measured.
The other limit is sample size. Two rounds of data is noise. Eight to twelve rounds across varied conditions starts to reveal real patterns. If you’re planning a major fitting investment — say, a full iron set in the $800–$1,200 range or a custom driver build — give yourself a full season of Arccos data before making the call. The longer the dataset, the more defensible the fitting conversation.
If X, Then Y: The Decision Rules
Here’s the clearest way to map your Arccos data to a fitting action:
If your SG: Approach is below −0.5 and your distance gaps are irregular, prioritize an iron fitting over any other equipment decision. The data is pointing at consistency and gapping, not driver length.
If your SG: Off the Tee is below −0.6 and your on-course driver distances are clustering 20+ yards below your expected carry, a driver fitting with shaft-flex and launch-angle optimization is defensible — but confirm the issue isn’t technique-driven by getting a lesson before the fitting.
If your proximity numbers collapse specifically in the 75–100 yard range, a dedicated wedge fitting and loft/bounce analysis is the highest-ROI move, often under $300 in equipment cost but disproportionately valuable for scoring.
If your data looks relatively even across categories — no SG category below −0.4, distances consistent — you’re likely in an equipment-maintenance cycle, not an upgrade cycle. The fitting case isn’t there yet. Bank the rounds, keep the data clean, and revisit in six months.
The investment argument for Arccos — the sensor system runs around $180–$230 for a full 14-club set plus annual subscription — is that it turns a subjective feeling (“my irons feel off”) into a quantified claim (“I’m losing 0.8 strokes per round on approaches between 125 and 150 yards”). That’s the language fitters respond to, and it’s the difference between a session that produces real equipment answers and one that just generates a pile of launch monitor numbers with no real-world context to anchor them.
Bring the data. Frame the session. Spend smarter.